应用场景 · OEE 优化不要只测量 OEE。
不要只测量 OEE。
理解其原因。
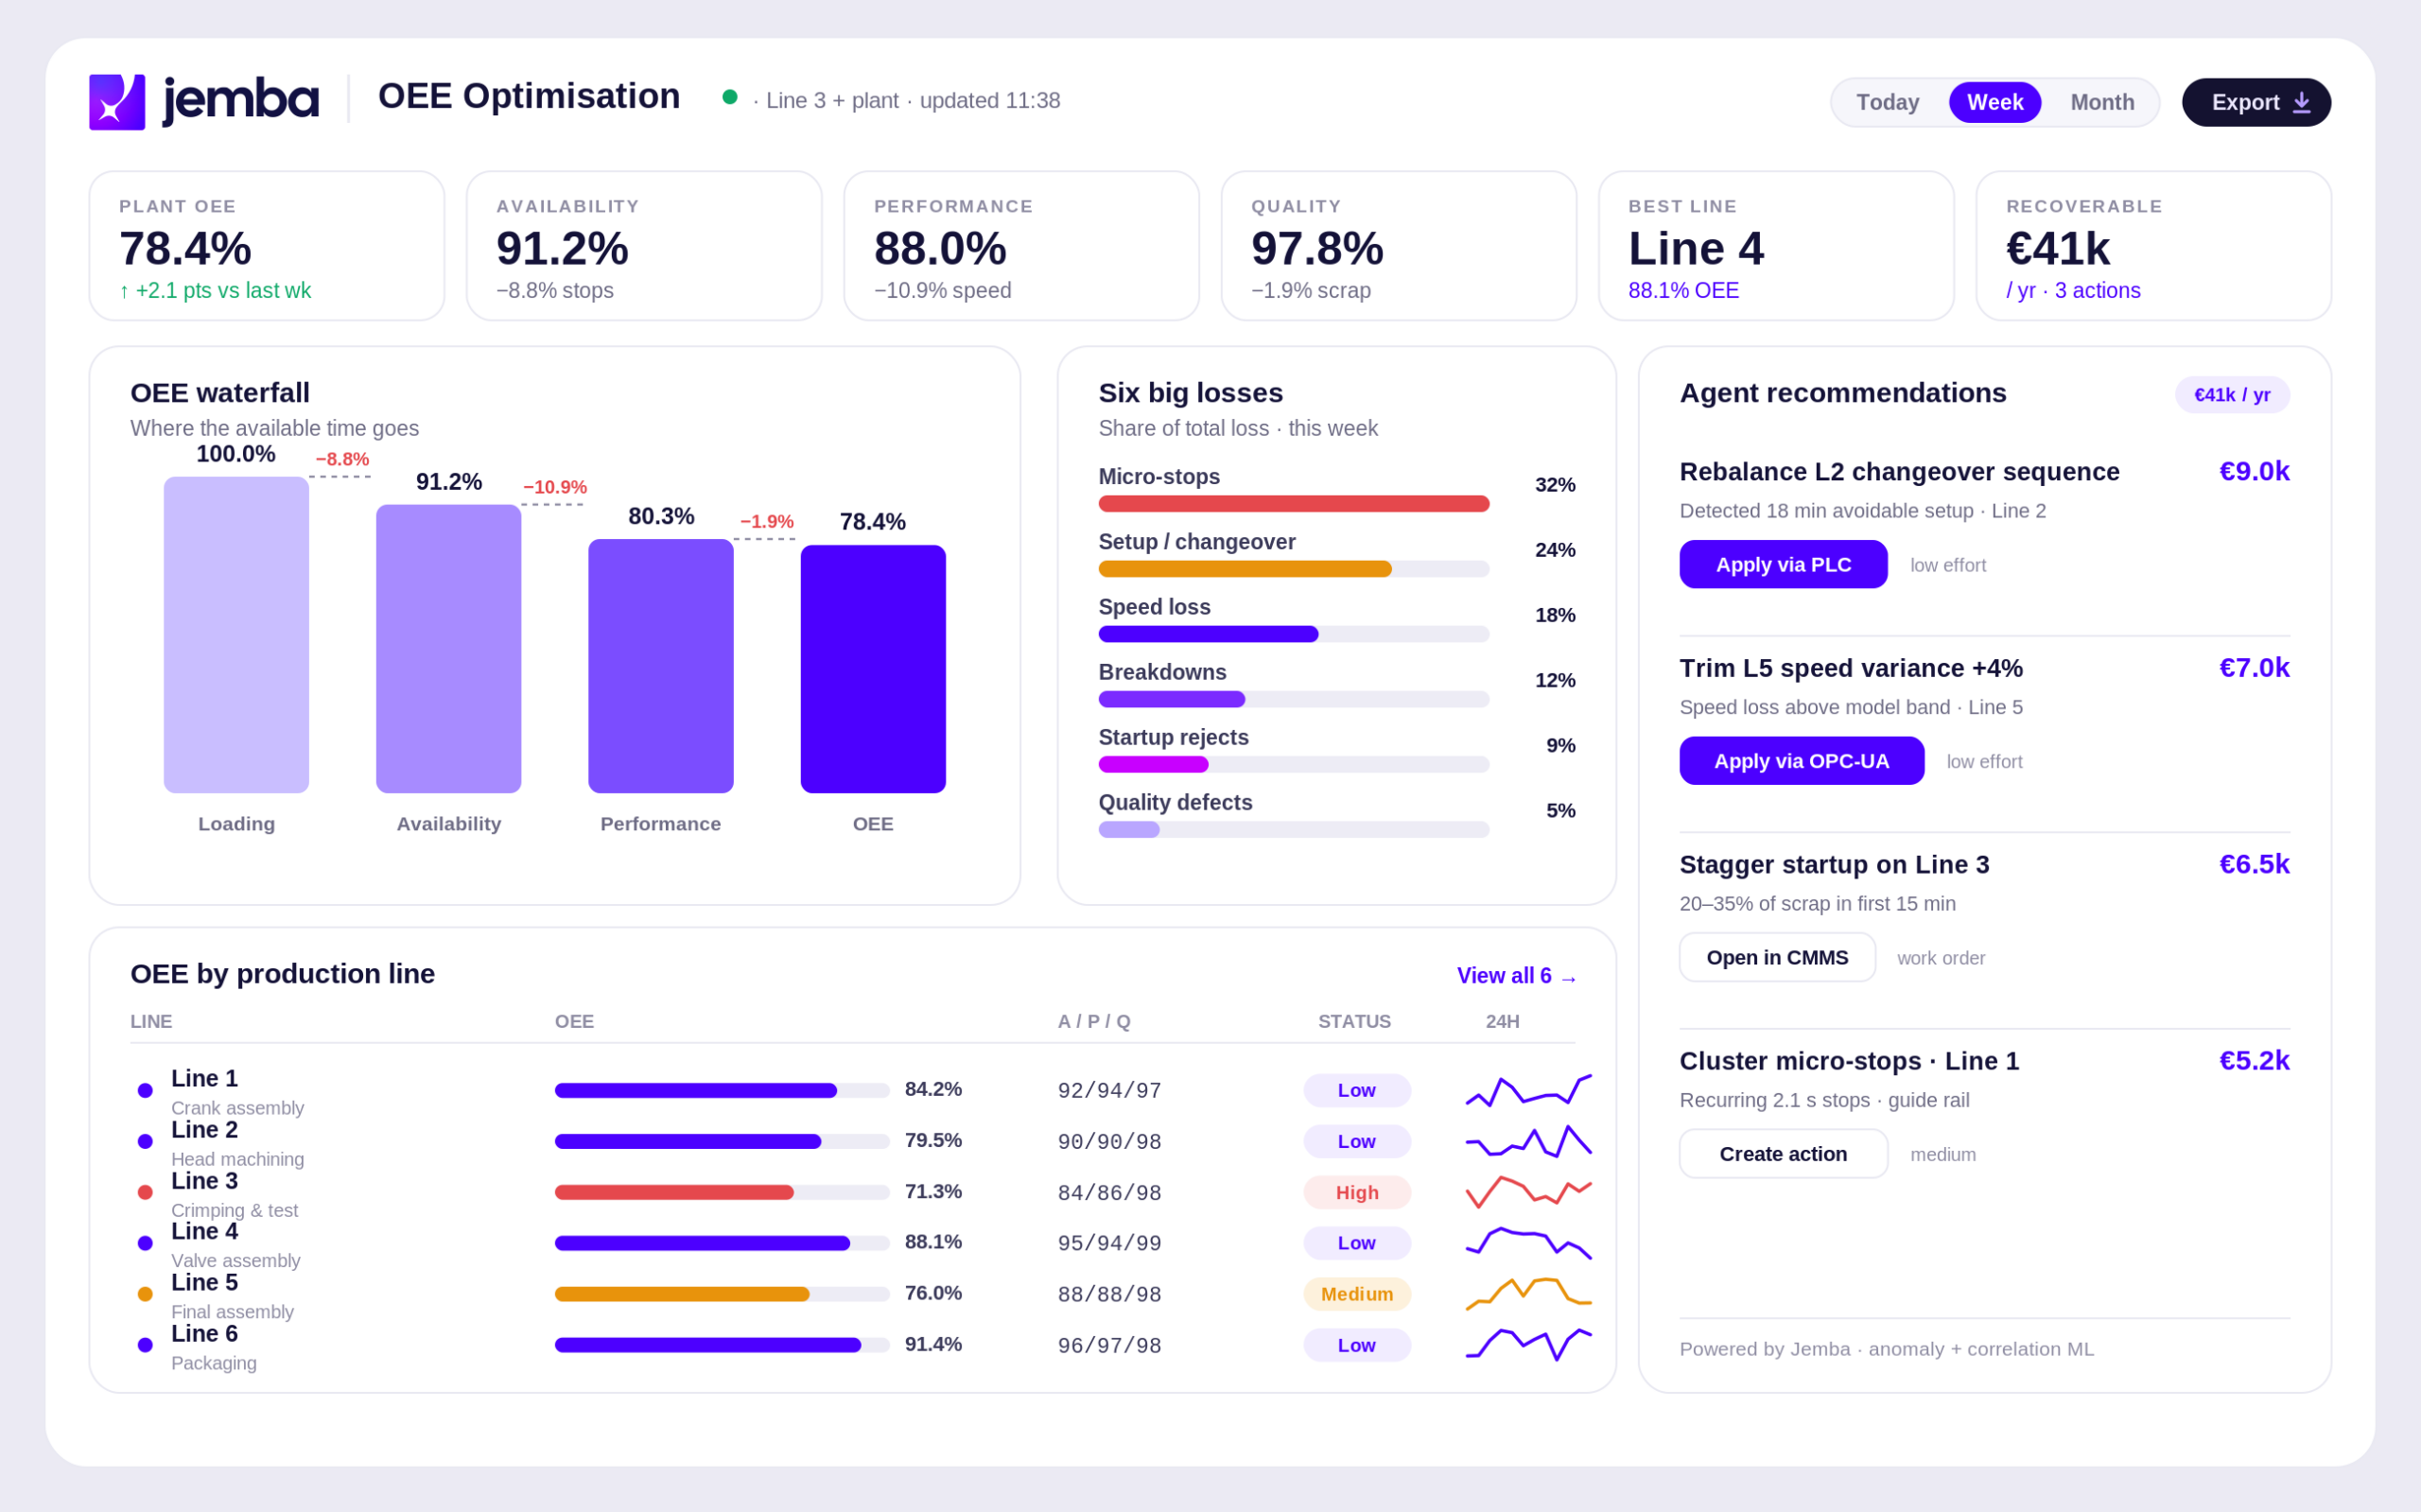
大多数 OEE 工具只给您一个数字。Jemba 构建在 TeepTrak 数据流之上并加以解释——哪些损失、哪些产线、哪些原因——再按影响对改进措施排序,让下一个 OEE 百分点不再靠猜。
无需信用卡 · 无需数据科学家 · 48 小时完成部署
问题所在
仪表板告诉您 OEE 是 62%。
它没告诉您该怎么办。
可用率、性能和质量各自隐藏着十几种原因。知道分数,并不能告诉您应先处理微停机、一次漫长的换型,还是一次质量漂移。Jemba 分解损失并按可回收产量排序——改进待办清单自动生成。
Jemba 如何做到
数字,加上
背后的原因。
基于您已经使用的 TeepTrak 数据流,Jemba 将每一个损失的 OEE 百分点归因到某个原因和某条产线——并告诉您哪种修复带回最多产量。
- 损失拆分为可用率、性能、质量——附带原因。
- 修复按可回收产量排序,而非凭感觉。
- 构建在 TeepTrak 上——无需新传感器,约 4 周见首个结果。
工厂智能 — 各产线 OEE、损失分解与排序后的行动
由 TeepTrak 提供支持
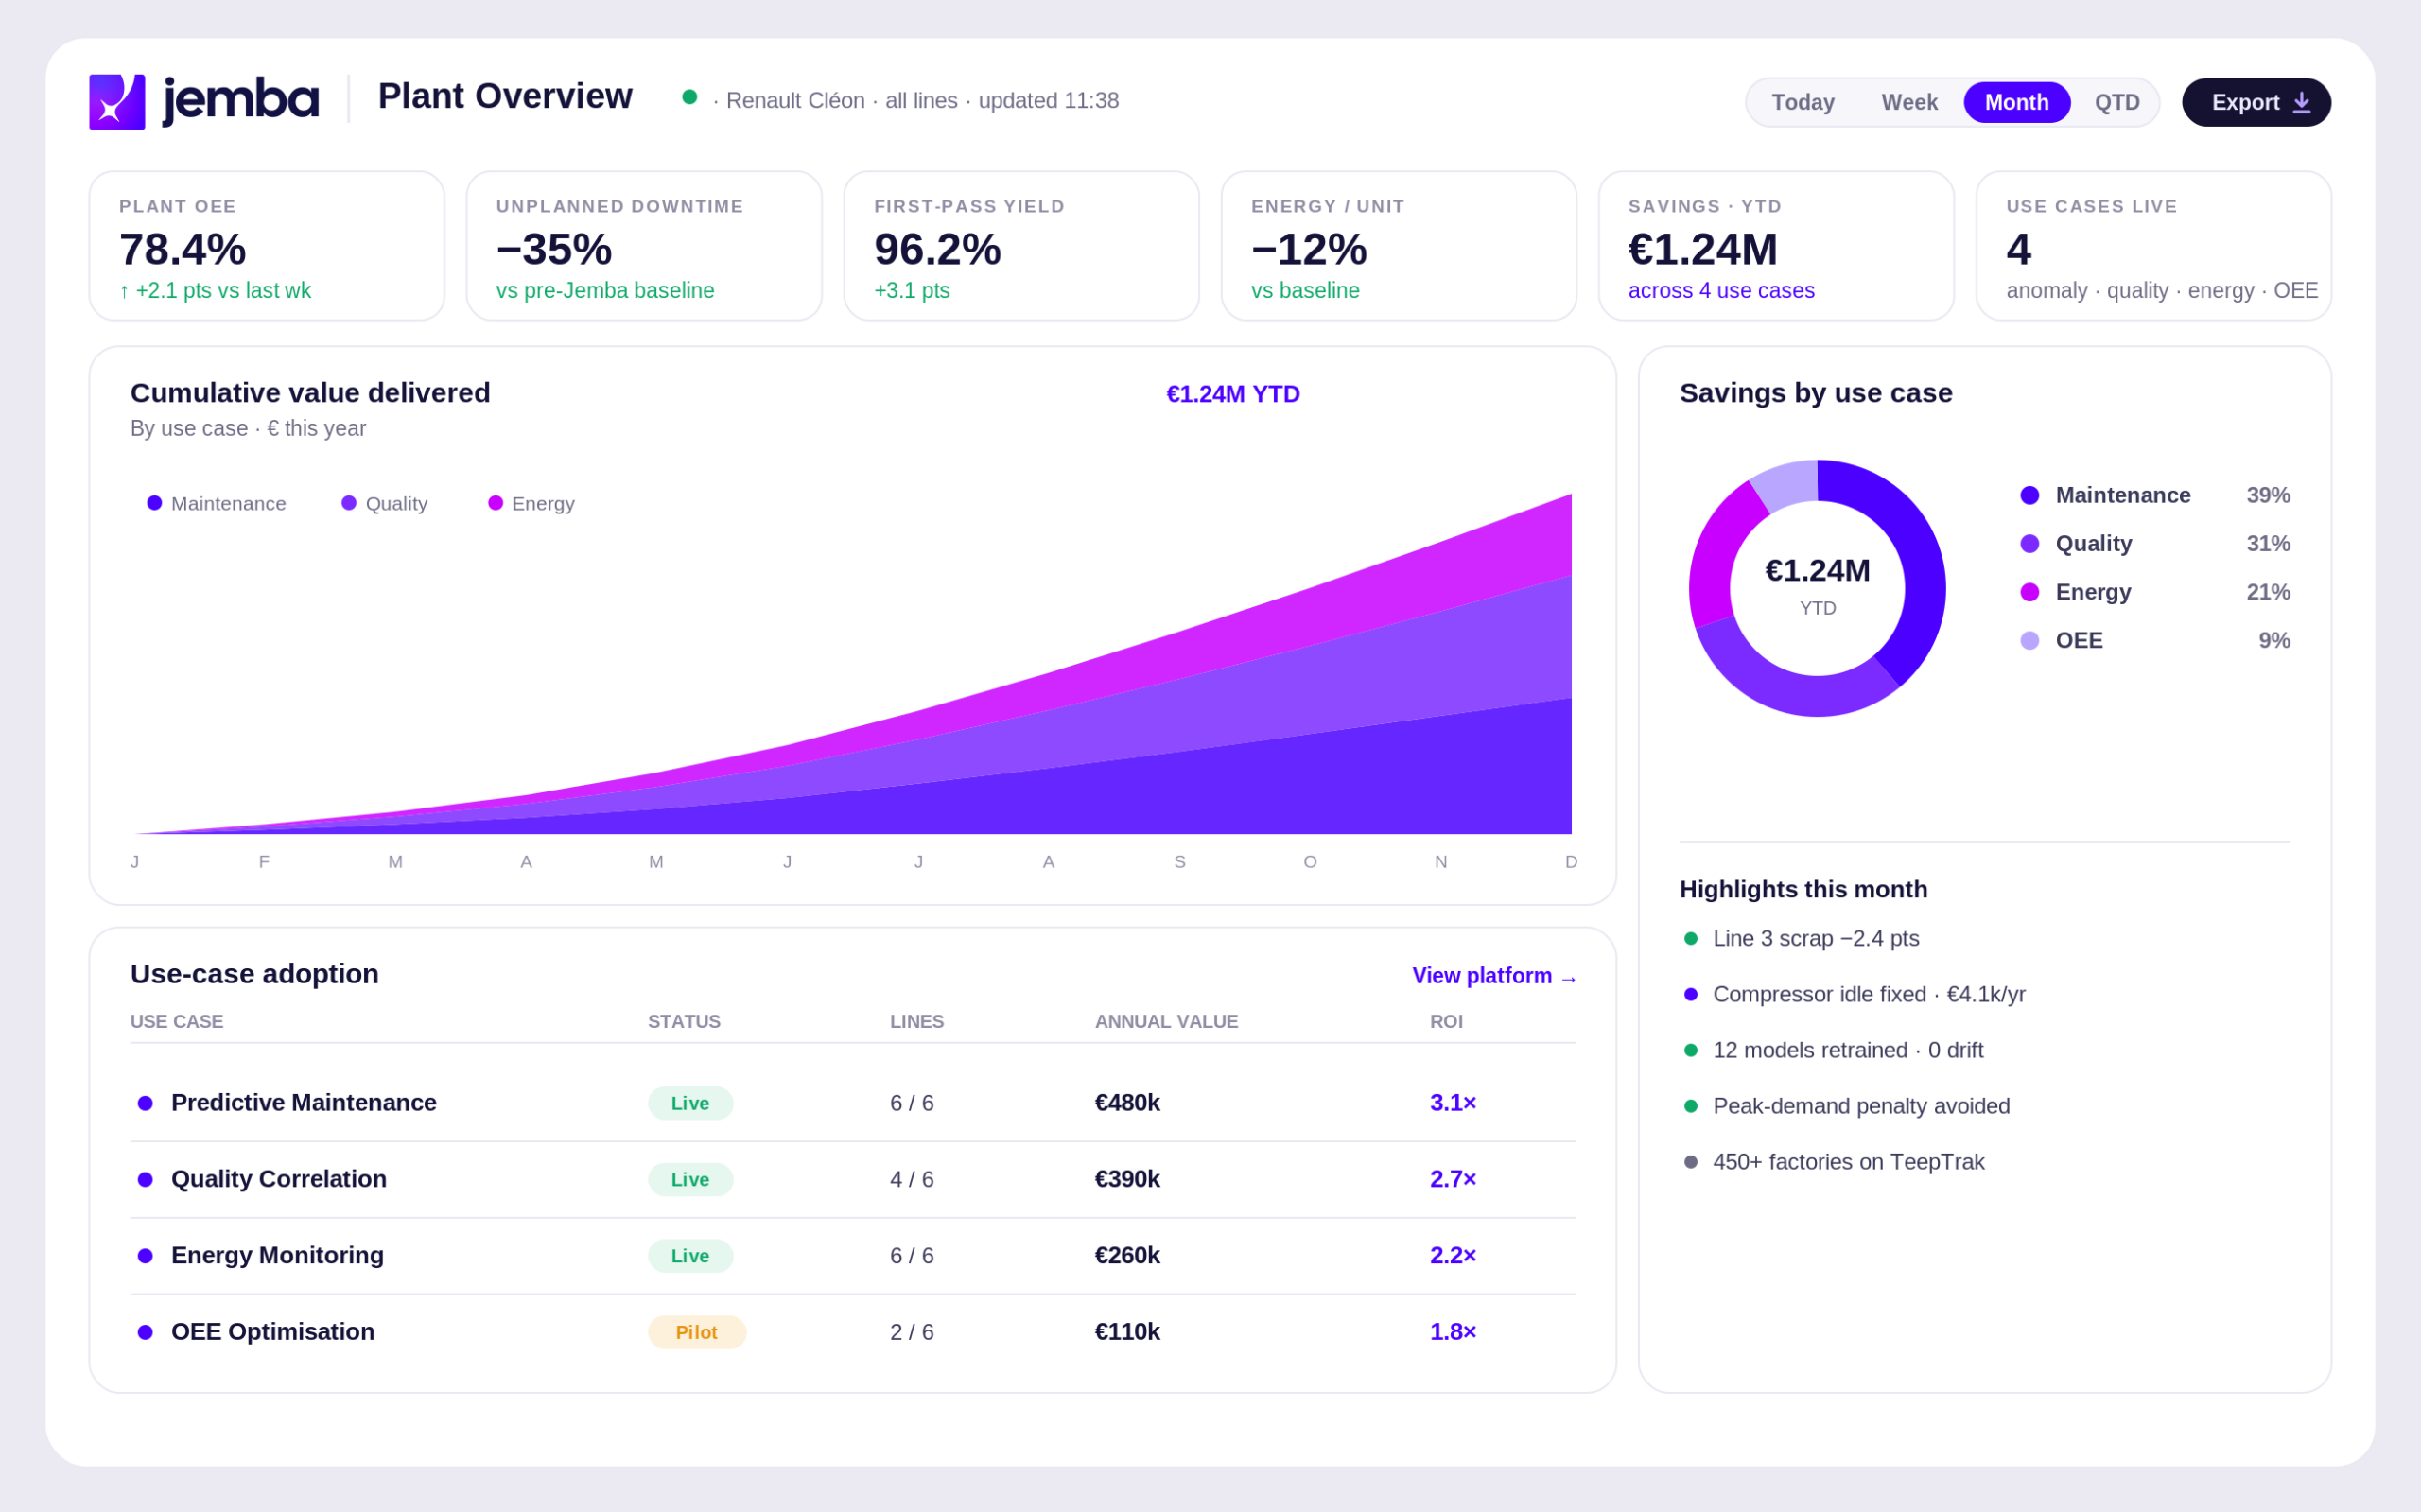
450+ 家工厂的信赖之选。
Jemba 出自 TeepTrak——制造商已经在产线上使用的生产监控平台,在 30+ 个国家得到验证。
3
类损失被分解
~4 周
见到首个结果
0
需要新传感器
1
份优先级行动清单
运作方式
从分数到行动,
只需四步。
A
连接
基于您已使用的 TeepTrak OEE 数据流。
B
分解
Jemba 将每个损失点归因到原因和产线。
C
排序
修复按可回收产量排序。
D
改进
处理待办清单;实时跟踪收益。
FAQ
常见问题
Jemba 如何提升 OEE?
它将可用率、性能和质量损失与其根本原因关联起来,让您只需解决对 OEE 影响最大的少数问题。
Jemba 会取代我的 MES 吗?
不会。它在您已采集的数据之上,为 MES 或历史数据库补充由机器学习驱动的根因分析。
它能解释哪些 OEE 损失?
微停机、速度损失、换型漂移以及与质量相关的减速——按影响大小排序。
多久能产生价值?
约 48 小时完成安装,数据连接后即可获得按优先级排序的建议。