No solo mida el OEE.
Entienda el porqué.
La mayoría de las herramientas OEE le dan un número. Jemba se apoya en el flujo TeepTrak y lo explica — qué pérdidas, qué líneas, qué causas — y ordena las soluciones por impacto, para que el siguiente punto de OEE no sea una adivinanza.
Un panel dice que el OEE está en 62%.
No dice qué hacer al respecto.
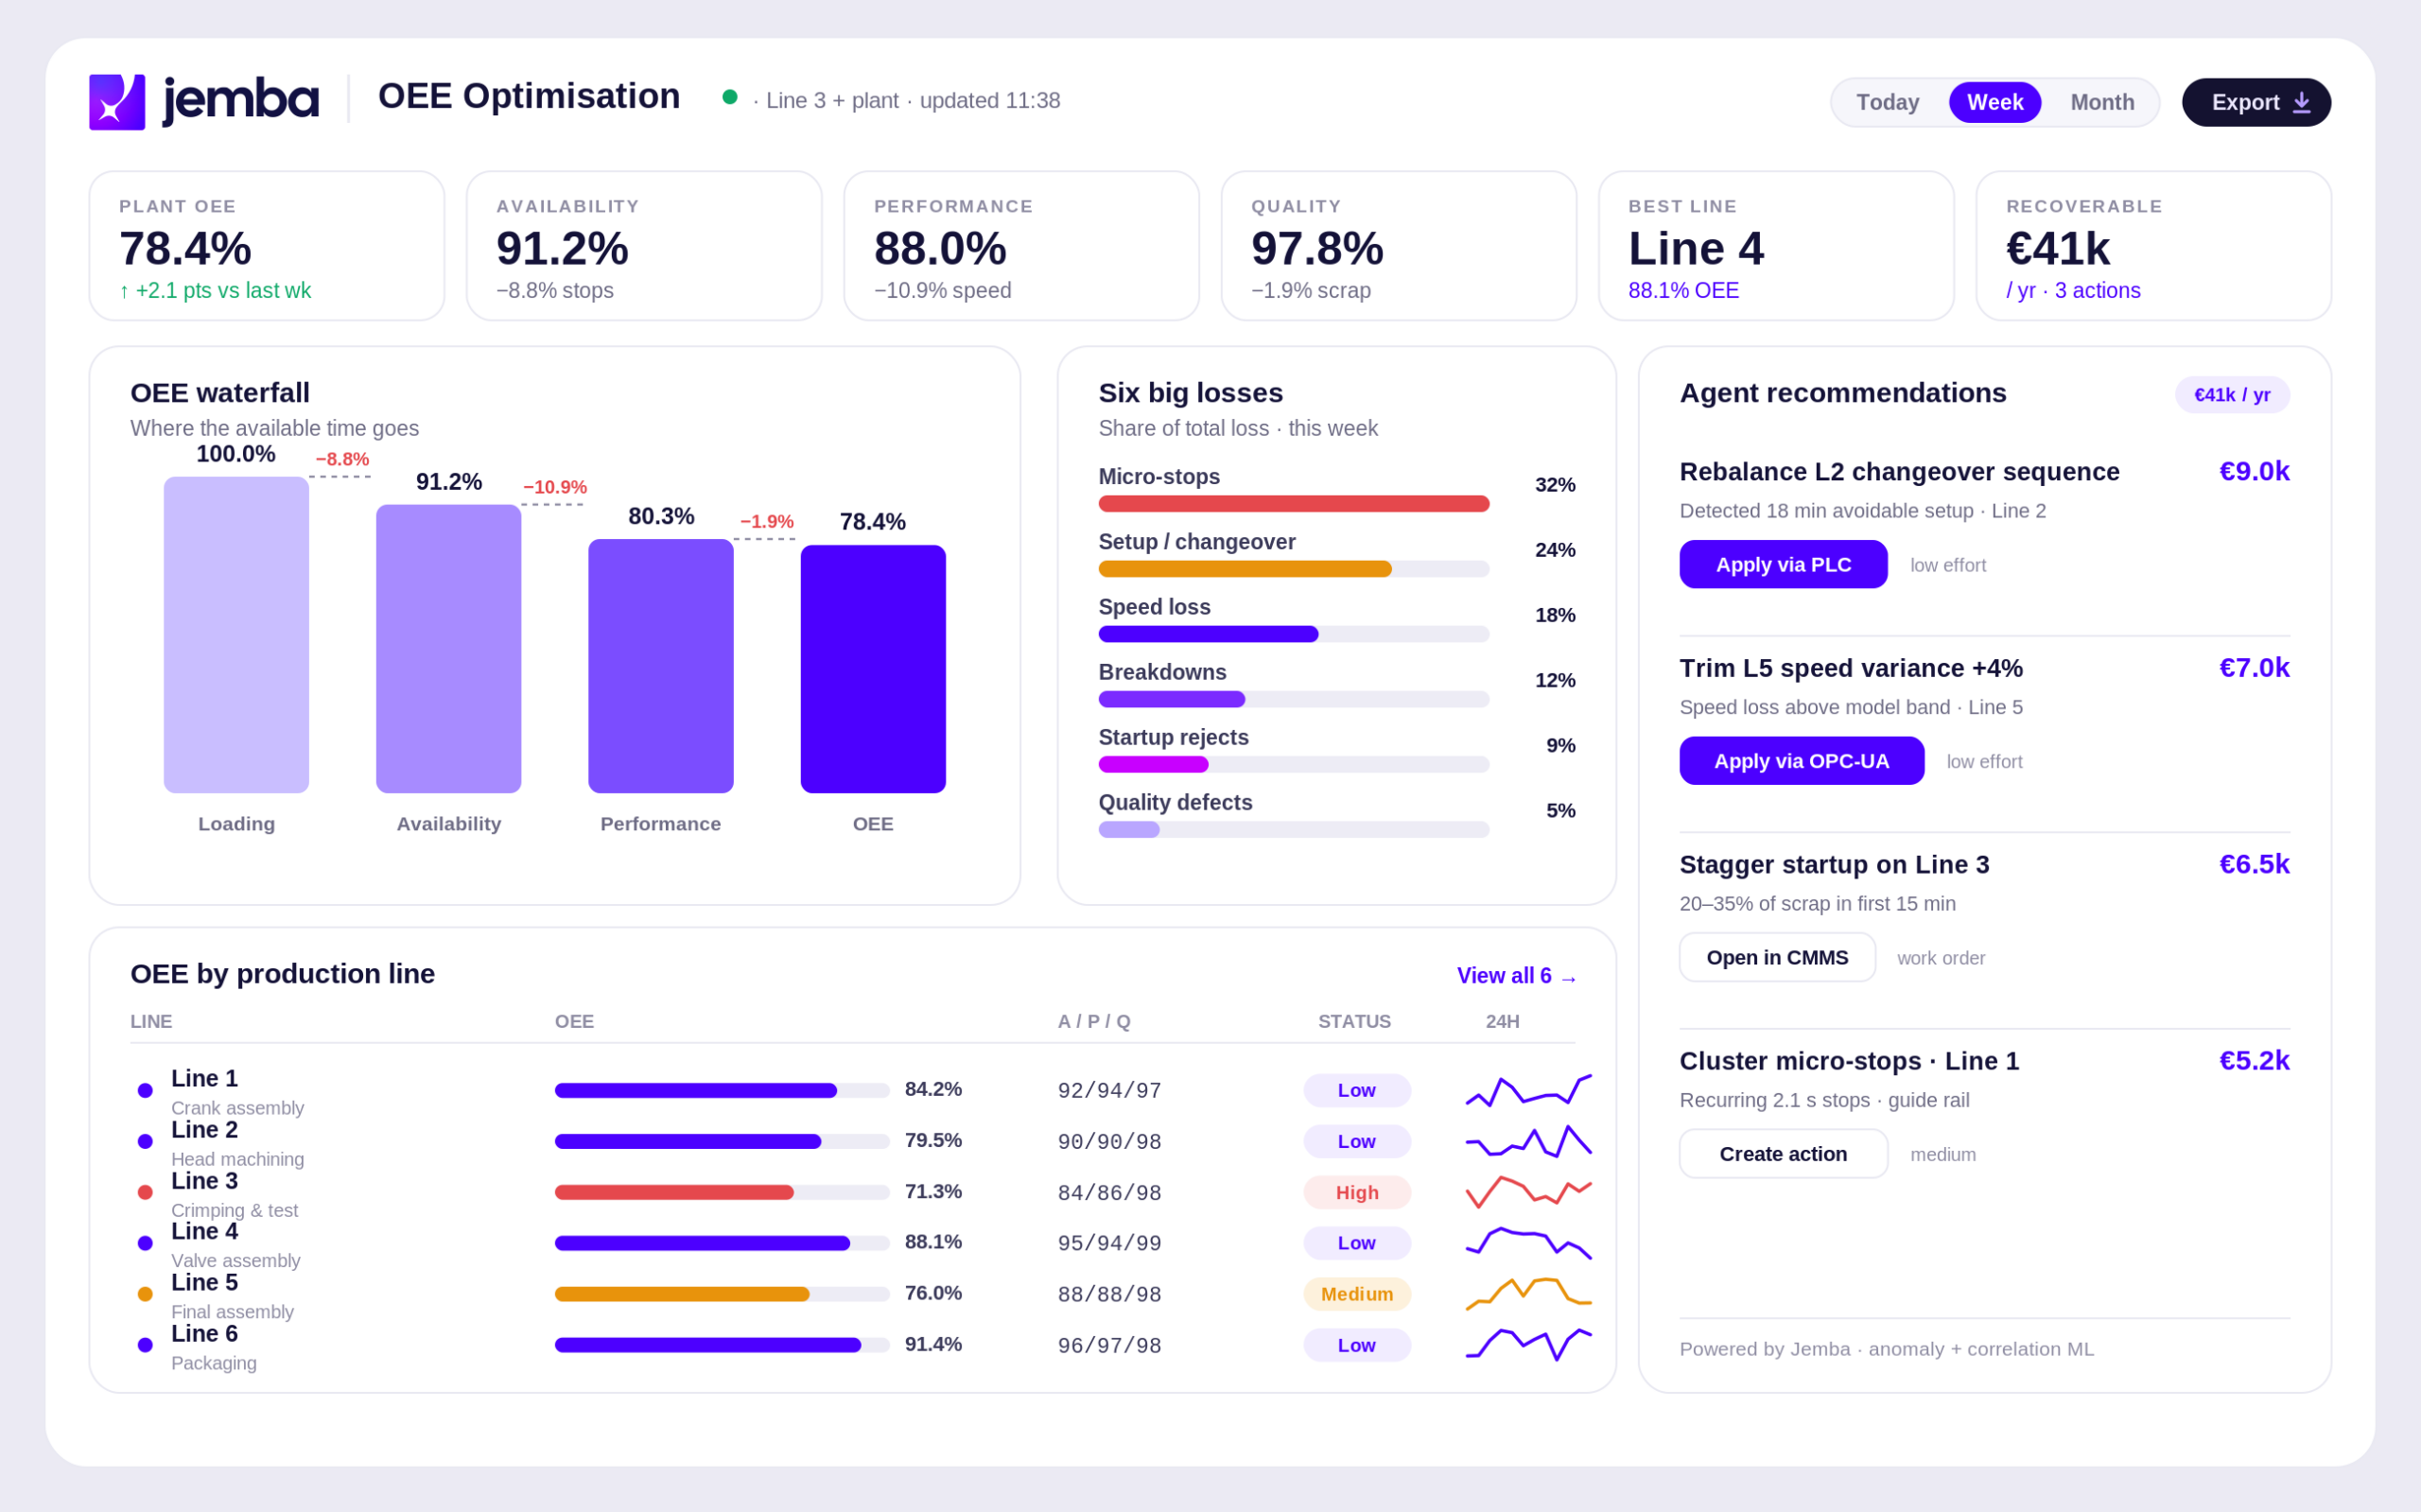
Disponibilidad, rendimiento y calidad esconden cada una una docena de causas. Conocer el dato no dice si atacar primero los microparos, un cambio de formato largo o una deriva de calidad. Jemba descompone las pérdidas y las ordena por producción recuperable — el backlog de mejora se escribe solo.
El número, más
la razón detrás.
Construido sobre el flujo TeepTrak que ya usa, Jemba atribuye cada punto de OEE perdido a una causa y una línea — y le dice qué solución devuelve más producción.
- Pérdidas divididas en disponibilidad, rendimiento, calidad — con causas.
- Soluciones ordenadas por producción recuperable, no por intuición.
- Se apoya en TeepTrak — sin sensores nuevos, primer resultado en ~4 semanas.
La confianza de más de 450 plantas.
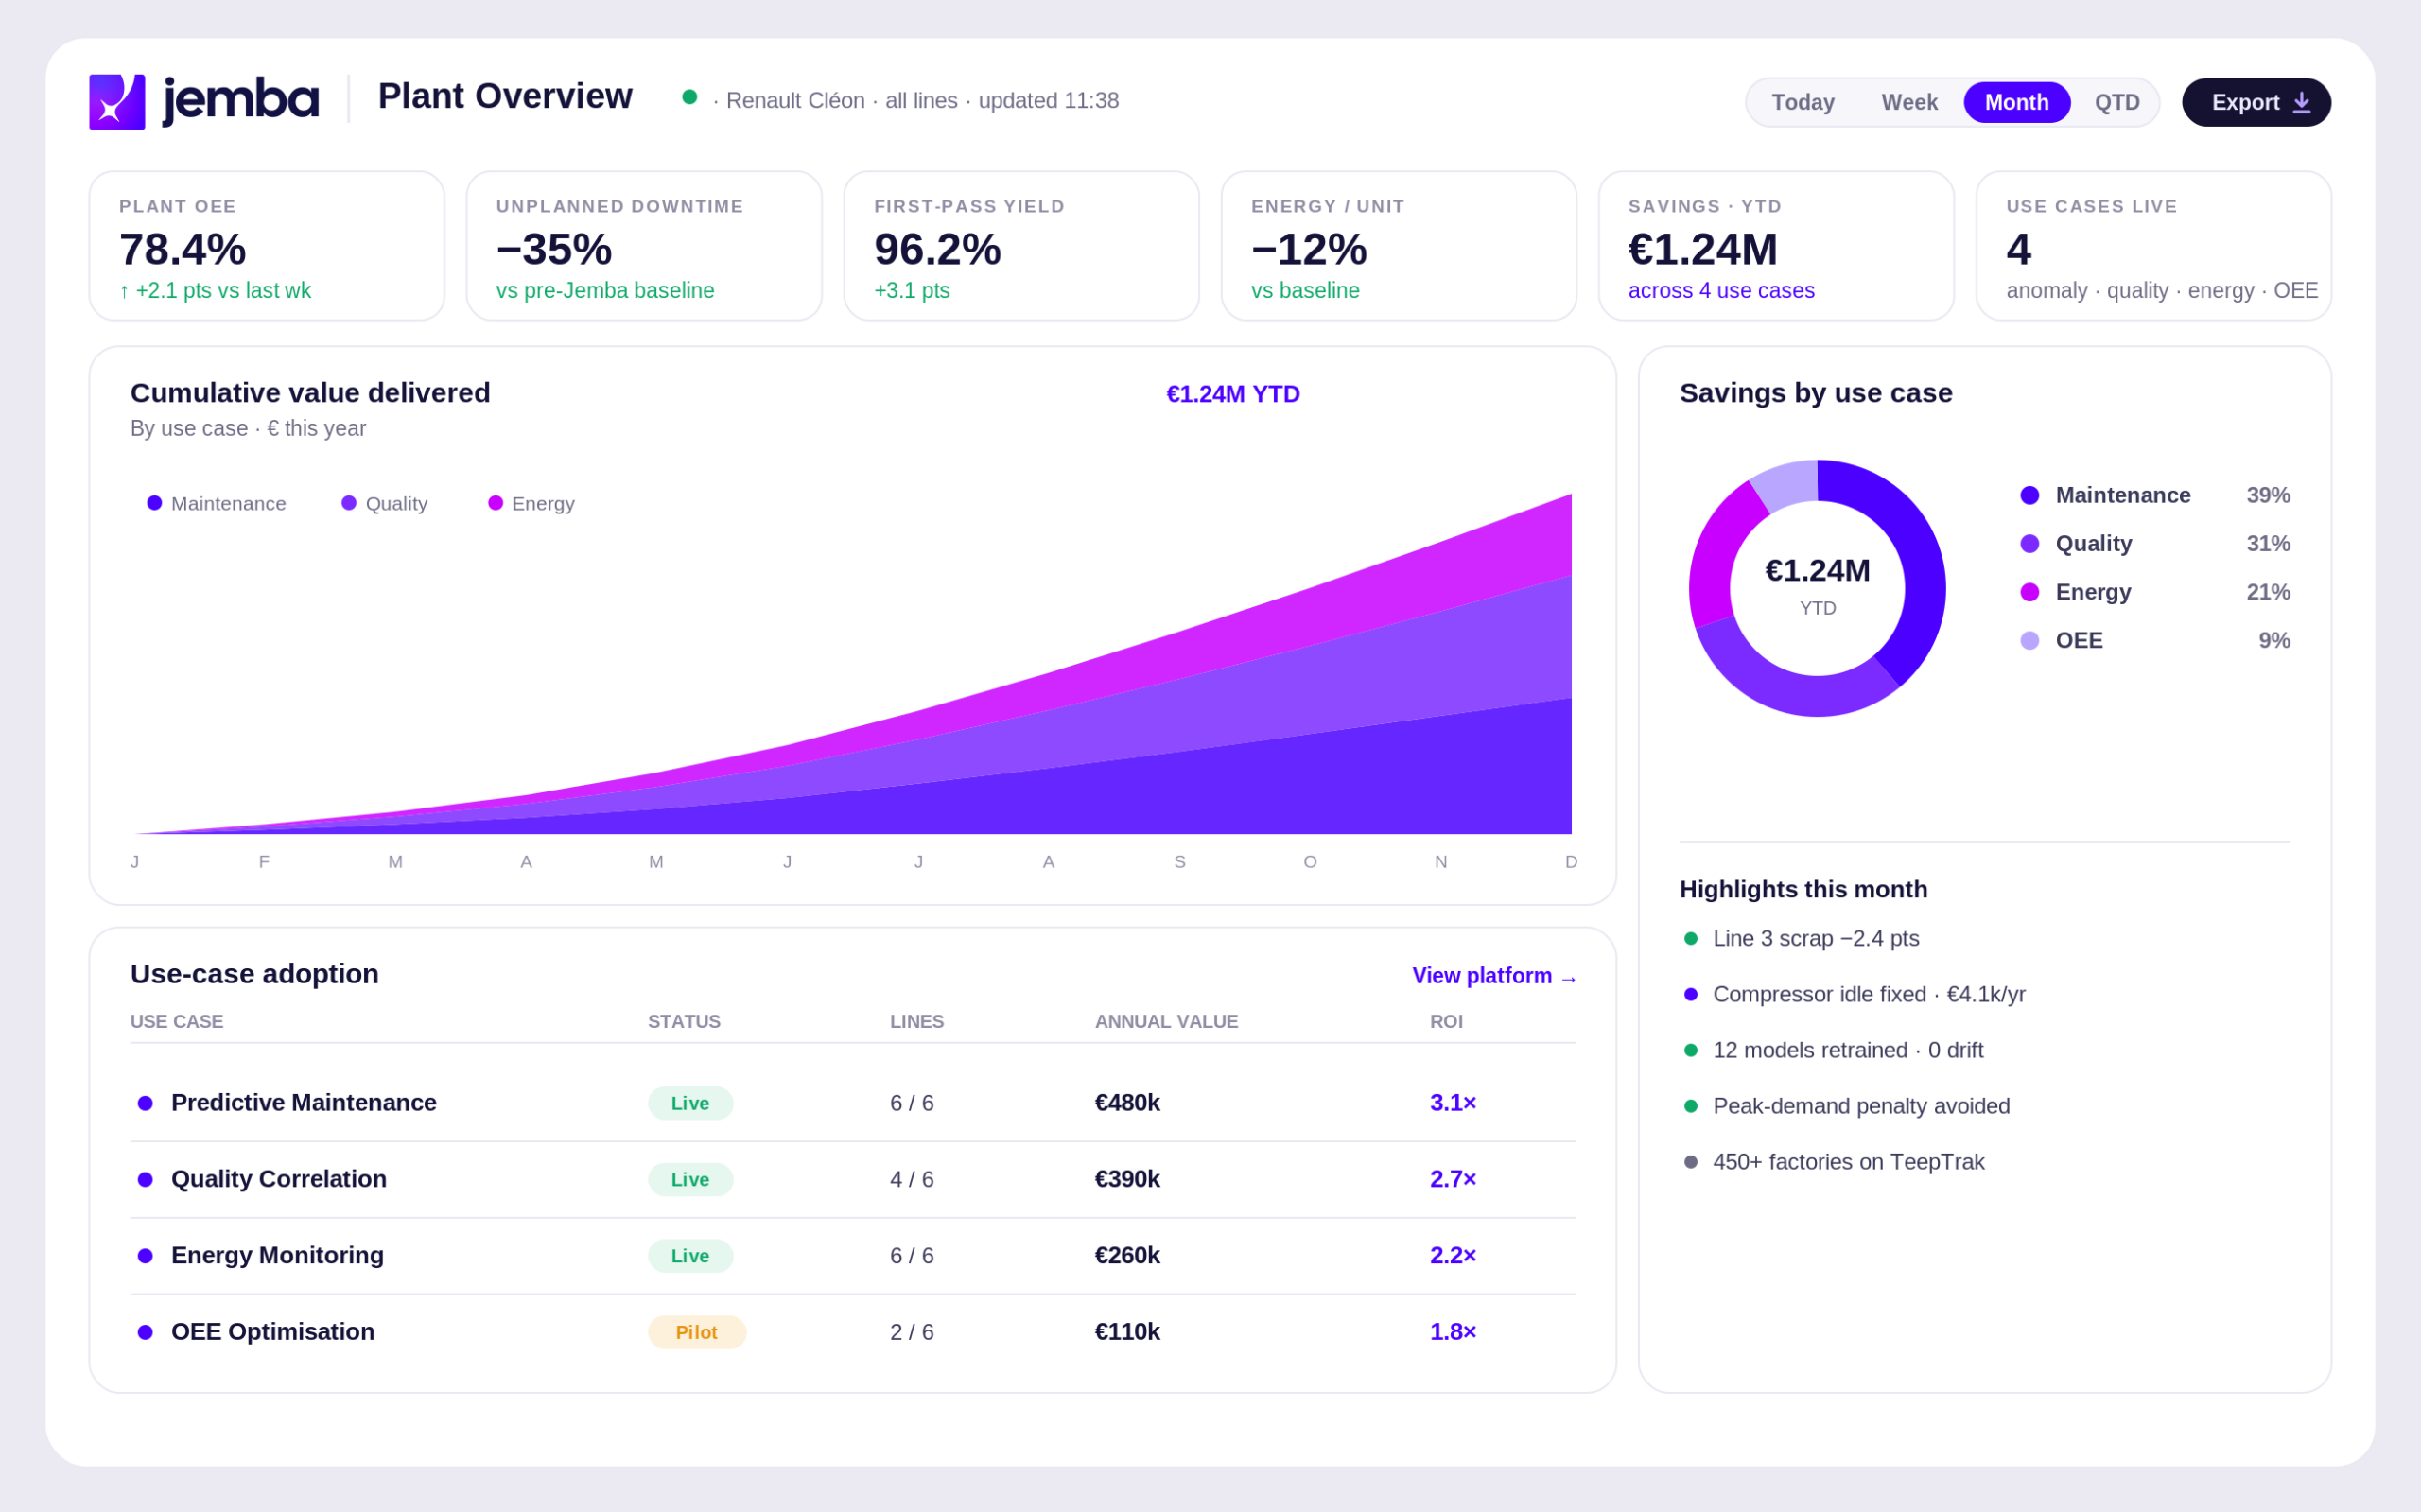
Jemba es de TeepTrak — la plataforma de monitoreo de producción que los industriales ya usan en la línea, probada en 30+ países.
Del dato a la acción,
en cuatro pasos.
Conectar
Sobre el flujo OEE de TeepTrak que ya usa.
Descomponer
Jemba atribuye cada punto perdido a una causa y línea.
Ordenar
Soluciones ordenadas por producción recuperable.
Mejorar
Trabaje el backlog; siga la ganancia en directo.
Una plataforma.
Cuatro formas de ganar.
Encuentre su próximo punto de OEE — y dónde se esconde.
Reserve una demo de 15 minutos o inicie una prueba gratuita. Instalación en 48h, sin data scientist.
Preguntas frecuentes
¿Cómo mejora Jemba el OEE?
Conecta las pérdidas de disponibilidad, rendimiento y calidad con sus causas raíz, para que corrijas las pocas cosas que más mueven el OEE.
¿Jemba sustituye a mi MES?
No. Complementa tu MES o historiador añadiendo análisis de causa raíz por ML sobre los datos que ya recoges.
¿Qué pérdidas de OEE puede explicar?
Microparadas, pérdida de velocidad, deriva de cambios de formato y ralentizaciones ligadas a la calidad — ordenadas por impacto.
¿Cuánto tarda en dar valor?
Unas 48 horas de instalación, con recomendaciones priorizadas una vez conectados tus datos.