
JEMBA: A Tulip Analytics Alternative for Industrial ML Beyond No-Code MES
The search for a credible tulip analytics alternative has emerged as one of the most distinctive conversations in industrial software in 2026. Tulip Interfaces has built a strong position as a modern no-code platform for manufacturing operations, frontline apps and shop-floor digitalization. Many manufacturers initially adopted Tulip for its ease of use, operator-friendly app building, and rapid deployment of digital work instructions. Then, as their data volume grew, they hit a natural ceiling: Tulip’s analytics capabilities are excellent for operational dashboards and standard reporting, but were not designed for production-grade multi-variable machine learning on hundreds of process variables.
JEMBA, developed by TEEPTRAK with 360+ industrial deployments across 30 countries, has emerged as the leading complement and alternative when manufacturers need to extend beyond no-code MES analytics into genuine industrial ML. This article explains why this gap exists, how the two platforms compare, and how to combine or replace them depending on your situation.
What manufacturers expect from a tulip analytics alternative
Discussions with industrial leaders evaluating analytics options beyond Tulip reveal a consistent expectation set:
- Genuine multi-variable machine learning — correlation analysis across hundreds of process variables, not dashboards on a handful of KPIs
- Predictive analytics with measured detection rates — anomaly detection, quality prediction, maintenance forecasting with published performance metrics
- Production-grade real-time response — alerts in seconds, not batch analytics computed hours after the fact
- Native industrial data integration — historians, MES, SCADA, LIMS, IoT — not just app-generated data
- Shop-floor adoption with operational autonomy — usable by production teams without internal data scientists
- Predictable per-site economics — subscription pricing aligned with industrial reality, not per-user app pricing
JEMBA was designed from day one to meet exactly these expectations, with a vertical ML architecture purpose-built for industrial production environments.
Why Tulip Analytics faces architectural limits for production-grade ML
To understand why a purpose-built tulip analytics alternative like JEMBA delivers stronger ML outcomes, it helps to examine the structural constraints of any no-code MES platform extended into analytics.
Constraint 1: Analytics designed around app-generated data
Tulip’s analytics layer is naturally optimized around data generated by Tulip apps: form inputs, work instruction completions, operator interactions. This is genuinely useful for operational KPIs and process compliance metrics. But it differs structurally from analyzing hundreds of high-frequency sensor signals, PLC tags and historian time-series — the raw material of industrial ML. By contrast, JEMBA’s architecture treats high-volume industrial time-series as the central input from day one.
Constraint 2: Dashboard analytics versus predictive ML
Tulip’s analytics excels at descriptive and operational dashboards: what happened, when, how often, by whom. These dashboards are valuable for operations management. But production-grade industrial ML requires a different category of capability: predicting what will happen next, identifying multi-variable causes that no dashboard can reveal, generating real-time alerts before incidents occur. This is what JEMBA was architected to do.
Constraint 3: No-code simplicity versus multi-variable depth
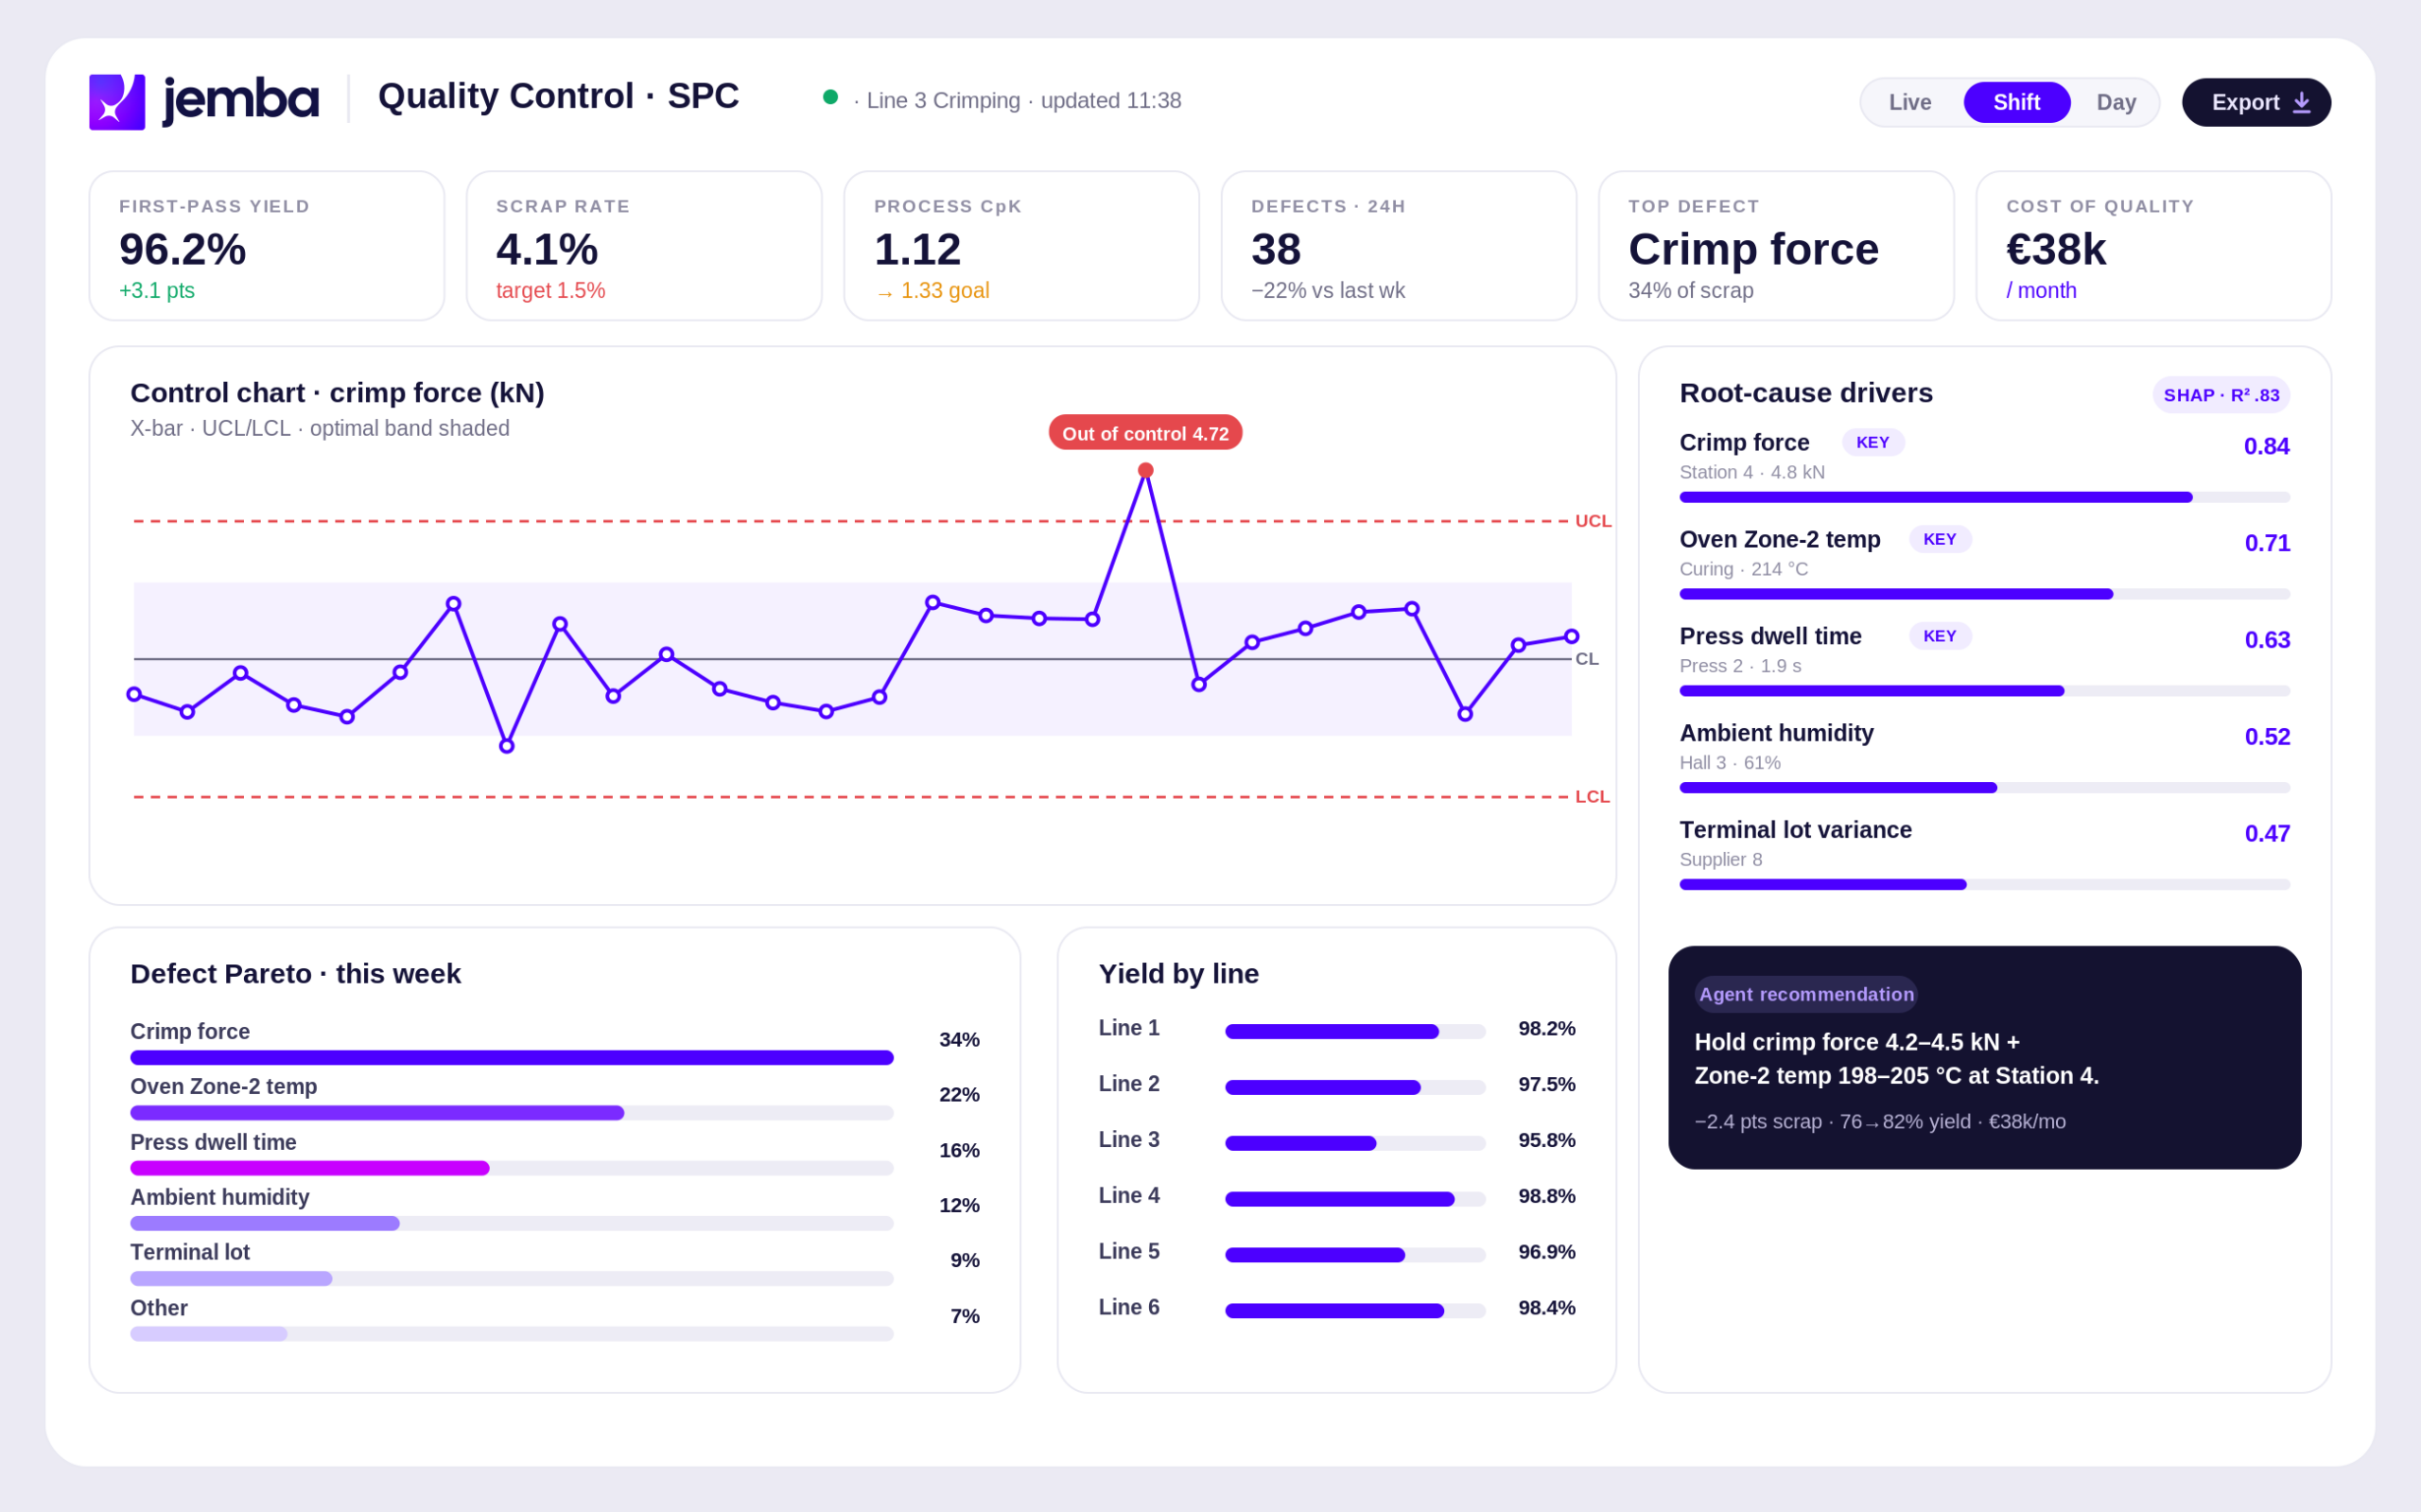
Tulip’s no-code philosophy is a strength for app building and process digitalization, but it imposes natural limits on the depth of analysis achievable. Identifying 10 critical parameters out of 700 process variables that explain 83 percent of yield losses (JEMBA’s flagship case) requires specialized ML algorithms that cannot reasonably be exposed through generic no-code interfaces.
Constraint 4: Operations-centric versus engineering-centric
Tulip’s primary user is the operations leader building frontline apps. JEMBA’s primary user is the production, quality or maintenance team needing actionable ML insights on complex process behavior. These are complementary needs, not competing ones — but they call for different platform architectures.
None of these points diminish Tulip Interfaces as a no-code MES and frontline apps platform — it remains a strong choice in that category. They simply explain why production-grade multi-variable ML benefits from a different architectural foundation.
How JEMBA delivers production-grade industrial ML
JEMBA was built ML-native from day one, with five characteristics that explain its emerging position as the leading tulip analytics alternative for serious industrial ML use cases:
Pre-built ML modules for top manufacturing use cases
Five modules come ready to deploy: quality root cause analysis, predictive maintenance, energy optimization, yield optimization, OEE improvement. Each is configured on customer data in days rather than months — and delivers measurable ROI within months 4 to 6 on most deployments.
Native industrial data integration at scale
JEMBA connects to historians (OSIsoft PI, Wonderware, GE Proficy), MES (SAP ME, Rockwell FactoryTalk), SCADA, LIMS and IoT platforms through native connectors. Time-series alignment, sensor drift handling and missing data management are built-in rather than requiring custom development.
Multi-variable analysis on hundreds of variables
JEMBA simultaneously analyzes hundreds — even thousands — of process variables to identify the 10 critical parameters that explain 80 percent of performance losses (the 10/80 rule). This level of multi-variable depth is impractical with dashboard-focused architectures.
Sub-2-second response time on real-time data
The ML engine generates predictive alerts in under 2 seconds, with a measured 99.7 percent detection rate across 360+ deployments. This combination of speed and accuracy enables genuine real-time operator integration that pre-empts incidents.
Operational autonomy without data scientists
JEMBA is operated by existing production, quality and maintenance teams. Across 360+ deployments, customers have achieved 2.7x average year-1 ROI without hiring internal data scientists. This is critical given the structural scarcity of industrial data science talent.
Explore the technical architecture in detail on the JEMBA platform page.
Head-to-head comparison: JEMBA versus Tulip Analytics for industrial ML
| Dimension | Tulip Analytics | JEMBA |
|---|---|---|
| Primary architecture | No-code MES with analytics layer | Vertical ML platform |
| Primary use case strength | Frontline apps and dashboards | Multi-variable ML and predictive analytics |
| Data scope | App-generated and limited sensors | Historians, MES, SCADA, LIMS, IoT |
| Variables simultaneously analyzed | Tens of KPIs | 700+ variables |
| Analytics type | Descriptive and operational | Predictive and prescriptive |
| ML detection rate | Not publicly benchmarked | 99.7 percent (360+ deployments) |
| Real-time alert latency | Batch-oriented dashboards | Under 2 seconds |
| Average year-1 ROI | Variable, app-dependent | 2.7x average, pay-back under 6 months |
The 5 use cases where a tulip analytics alternative delivers stronger results
Use case 1: Multi-variable quality root cause analysis
When defects depend on combinations of 5, 10 or more process variables interacting in non-linear ways, dashboard analytics cannot reveal the cause. JEMBA’s multi-variable ML routinely identifies the 4 to 10 levers that explain the majority of defects, even when no single variable appears statistically significant on its own.
Use case 2: Real-time predictive maintenance on rotating equipment
JEMBA captures the subtle multi-sensor signatures that precede equipment failure, often hours or days before the breakdown. Result across 360+ deployments: minus 35 percent unplanned downtime. This level of predictive performance is not achievable through descriptive dashboards.
Use case 3: Yield optimization on complex processes
Flagship case: 700 process variables analyzed on automotive lines, 10 critical parameters identified, yield improvement from 30 to 80 percent on the pilot line, more than 2 million euros saved in year 1. This level of multi-variable yield optimization requires production-grade ML, not dashboard analytics.
Use case 4: Energy optimization across production conditions
JEMBA correlates energy consumption with hundreds of operating conditions to identify wasteful regimes. Average improvement: minus 20 percent energy waste, with pay-back typically under 6 months. The complexity of these correlations exceeds what dashboards can surface.
Use case 5: Real-time anomaly detection on high-frequency sensors
JEMBA’s sub-2-second response time enables genuine real-time anomaly detection across hundreds of high-frequency signals. This category of capability is structurally different from periodic dashboard refreshes.
The complementary path: combining Tulip and JEMBA
For many manufacturers, the most effective approach is not replacement but combination. Tulip Interfaces excels at frontline app building, operator workflow digitalization and operational dashboards. JEMBA excels at multi-variable predictive ML and production-grade analytics. Used together, the two platforms address different layers of the industrial data stack without overlap.
Typical hybrid architecture
- Tulip layer — operator apps, work instructions, manual data capture, operational KPI dashboards
- JEMBA layer — multi-variable ML on historian and SCADA data, predictive alerts, root cause analysis
- Integration — JEMBA alerts surfaced in Tulip operator interfaces; Tulip-captured data feeds into JEMBA’s ML analysis
This hybrid approach captures the operational accessibility of Tulip alongside the analytical depth of JEMBA. Each platform plays to its architectural strengths.
The flagship reference: 2 million euros saved in year 1 on 12 production lines
The clearest demonstration of production-grade ML value comes from JEMBA’s flagship automotive deployment. A French Tier 1 automotive supplier operating 12 production lines had stagnant yield at 30 percent despite years of operational dashboards and statistical tools.
Results within 6 months of JEMBA deployment
- 700 process variables analyzed simultaneously across 12 lines
- 10 critical parameters identified, explaining 83 percent of yield losses
- 4 actionable levers validated by shop-floor teams
- Yield improvement from 30 percent to 80 percent on the pilot line
- Over 2 million euros saved in year 1
- Pay-back of 4 months on the JEMBA investment
- Zero data scientists hired by the customer
We saved more than two million euros in year one — with zero data scientists in-house. JEMBA revealed combinations of parameters our best process engineers had been looking for over three years.
— VP of Operations, Tier 1 Automotive Supplier, France
More cases in our industrial case studies.
When Tulip Analytics remains the right choice
To be balanced, Tulip Interfaces remains the strong choice in specific scenarios:
- Your primary need is operator app building — work instructions, frontline data capture, mobile interfaces for production teams
- You need operational dashboards on a limited set of KPIs — not multi-variable ML across hundreds of inputs
- You value no-code app development — empowering operations leaders to build their own tools without IT dependence
- Your analytics scope is descriptive — measuring what happened, not predicting what will happen
- You operate in industries where frontline digitalization is the priority — for example aerospace, medical device manufacturing, life sciences operations
For ML-focused use cases where these conditions do not hold, a vertical platform delivers significantly stronger outcomes.
How to evaluate JEMBA as your tulip analytics alternative
Step A — Identify the ML use cases beyond Tulip’s scope (week 1)
Pick the 1 to 3 use cases where Tulip dashboards fall short: multi-variable quality analysis on a problematic product, predictive maintenance on critical equipment, yield optimization on a complex process.
Step B — Run a proof-of-value on real data (weeks 2 to 4)
JEMBA can demonstrate concrete ML results on your own historian and SCADA data within 4 weeks. This produces measured outcomes rather than theoretical capability comparisons.
Step C — Validate adoption with production and quality teams (weeks 4 to 8)
Test JEMBA alerts against operator domain knowledge. Adoption ease by non-data-scientist teams is the most reliable long-term ROI predictor.
Step D — Design the integration with existing Tulip deployment (week 8)
If you already have Tulip in production, define how JEMBA alerts surface in operator interfaces and how Tulip-captured data feeds back into JEMBA’s ML analysis. The hybrid model is often the best of both worlds.
The 4 mistakes to avoid when evaluating a tulip analytics alternative
- Comparing on overlap rather than complementarity — Tulip and JEMBA address different layers of the industrial data stack. The most powerful approach is often to use both, not to choose between them.
- Underestimating the dashboard-to-ML gap — operational dashboards and production-grade ML are different categories. A platform optimized for one cannot easily deliver the other.
- Ignoring data scope — Tulip excels with app-generated data. JEMBA excels with historian and SCADA time-series. Match the platform to the data source you actually need to analyze.
- Forgetting operator adoption testing — both platforms succeed only if shop-floor teams actually use them. Validate adoption explicitly during evaluation.
Conclusion: a credible tulip analytics alternative for production-grade industrial ML
For manufacturers seeking a credible tulip analytics alternative for production-grade multi-variable industrial machine learning, JEMBA represents the leading choice in 2026. With 360+ deployments across 30 countries, 99.7 percent ML detection rate, 4-week time-to-first-insight, and 2.7x average year-1 ROI, the platform delivers what dashboard analytics architectures structurally cannot.
This positioning does not displace Tulip Interfaces — which remains the leader in no-code MES and frontline apps. But for manufacturers whose ambitions extend into genuine ML on hundreds of process variables, a vertical platform like JEMBA delivers dramatic differences in time, accuracy and outcomes. The most sophisticated organizations often combine both, capturing operational accessibility from Tulip alongside analytical depth from JEMBA.
To evaluate JEMBA on your own use cases, the best starting point remains a personalized demo on real production data.
See Jemba on your own data
A 30-minute session with a product specialist. No data scientist required, 48-hour setup.